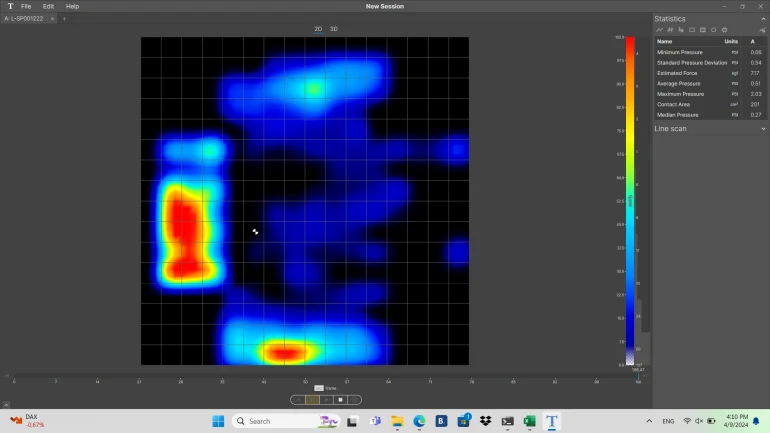

Tactilus is a graphical user interface software designed for the dynamic acquisition and real-time display of data from pressure sensors.
It provides tools for measurement interpolation, 2D and 3D graph plotting, statistical analysis, and saving or exporting data in both video and text formats.
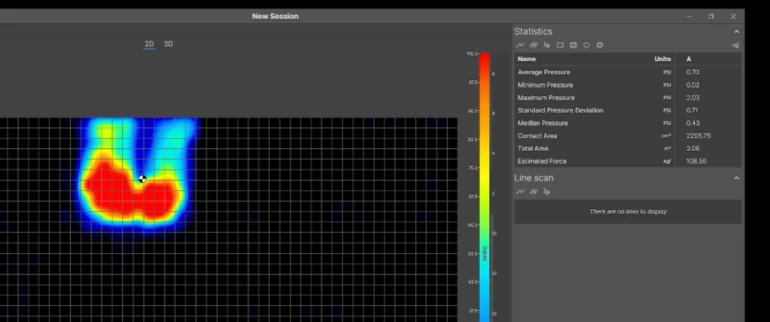
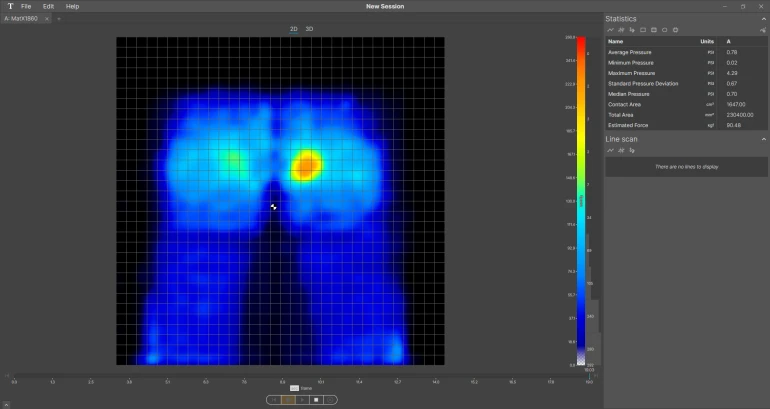
Primarily developed for use with Tactilus Sensors, the software generates pseudocolor images that represent the pressure or temperature distribution across
sensor areas.
Users can divide the screen into multiple sections, hide unwanted regions, and synchronize data recording with external devices or software.
Tactilus is highly versatile and fully customizable, offering a wide range of features for comprehensive data analysis and visualization.
TS10 Charateristics
- possibility to connect different pressure mapping devices
- Connection using USB, Bluetooth, Wifi
- Recording from multiple devices simultaneously
- 2D and 3D on line display
- evaluation of the following parameters:
- Average Pressure
- Minimum Pressure
- Maximum Pressure
- Median Pressure
- Standard Pressure deviation
- Contact area
- Total Area
- Estimated force
- CoV %
- Variance
- Dispertion
- Usage of 8 different type of units
- Management of colors and Histogram
- Tara setup
- Creation of Masks
- Calibration
- CoG
- Creation of different Area of Interest:
- Rectangular
- Circolar
- Free
- Lines
- graphs of all parameters
- Export Data in CSV
- Save and recall data
 Made in Italy